


Traditionally the term ‘Report’ was used to refer to the static canned reports. However today it also refers to the Analytic reports, thanks to the predominant usage of Analytical BI tools (such as Power BI and Qlik sense). In fact, in most cases the canned report themselves are build using the Analytical BI tools (which isn’t ideal). In this blog John Edward, Senior Consultant at Digia explores the differences between the two, and the specialized tools available to produce the canned reports.
Analytic vs Canned reporting
Analytic reports are useful for finding new insights and patterns in the data which would help steer a business. However, certain KPI and metrics needs to be followed periodically for which Canned report are best suited. Even though the same could be done through Analytic reports, it’s not the most efficient for that purpose. Also, the consistency of Canned reports helps read the data quickly, especially when shared with external parties such as customer, vendors, and authorities. While canned report offload some of the BI use cases, the importance of Analytic reports doesn’t fade. Without the analytic reports, new patterns and insights cannot be obtained, which is essential in any business. Also, the analytic reports could be used to explain causes / factors behind the data points shown in a canned report.
Here’s some key differences between Canned reports and Analysis apps that will help differentiate the two:
|
Canned |
|
Analytic |
|
Formatted |
|
Interactive |
|
Pre-determined |
|
Flexible |
|
Recurring |
|
Ad-Hoc |
|
Business Users |
|
Data Analyst |
|
What happened? |
|
Why it happened? |
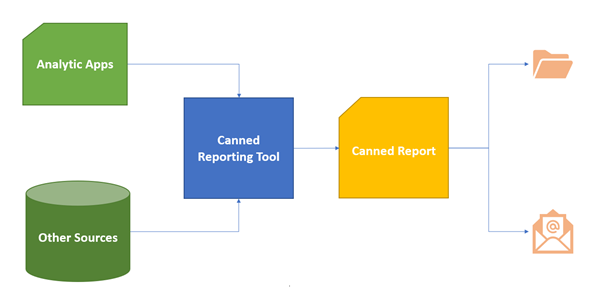
Canned reports
A Canned report has a pre-determined layout and, in most cases, delivered in specific file formats, by a specific delivery method (most commonly by email). Although Analytic tools such as Power BI and Qlik Sense can produce the same information, they require some manual effort it is getting the report in the required format. And this manual effort quickly adds up when this must be repeated periodically.
Depending on the use cases, the report could be file format that are editable (Word, Excel, PowerPoint) or not (PDF). In some scenarios, the report recipient could manually enrich the report with information from other sources. In such cases file formats such as Word, Excel and PowerPoint are preferred. PDFs could be used when the reports are complete in nature and/or send to recipients outside of the organisation (to ensure the integrity of it).
In most cases, e-mail is the preferred way of delivering the report. This way we do not introduce a new mode of communication/delivery. However, depending on the use case, subscription/delivery portals such as Power BI Service and Qlik NPrinting Newsstand can be used. But this involves some learning curve, although minimal.
Now let’s briefly discuss the go-to tools for canned reporting in the Microsoft and Qlik ecosystems. Given the predominance of the Analytic BI tools, these tools are designed to primarily use the Analytic application (from their respective camps) as the data source.
Power BI Report Builder
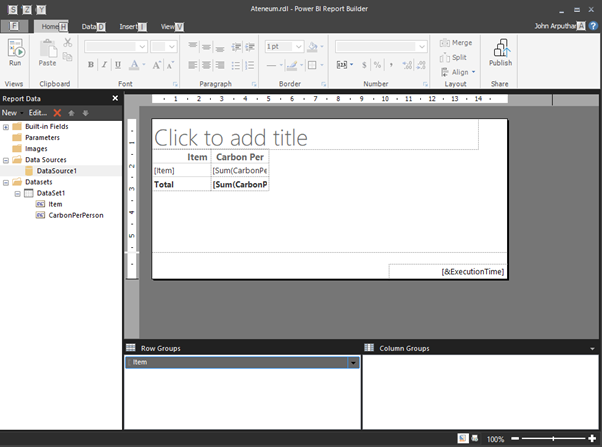
Canned reports can be created and delivered using the ‘Power BI Report Builder’. Although the tools is available for free, publishing of reports to Power BI service requires a Premium Power BI licence. This tool allows for creating paginated canned reports with great amount of customization and can be exported to various formats including Word, PowerPoint & PDF among others. Following are the data sources from which the data can be sourced to create these reports:
- Power BI Datasets
- Azure Analysis Services
- Azure SQL Database and Azure SQL Managed Instance
- Azure Synapse
- SQL Server
- SQL Server Analysis Services
- Oracle
- Teradata
- Dataverse
Below are some highlight features of Power BI Report Builder:
- Supports various data sources including databases, eliminating a dependency to other BI tools
- Reports are published to Power BI service, thus providing a single place for users for Analytic and Canned reports
- Report Builder can utilize measures defined with Power BI dataset, thereby not having to define them in multiple places
- Drill through provides a means of retrieving more detailed report for a selected datapoint
- Sub report feature allows for referencing existing report and enchanting, there changes to original report are automatically reflected wherever its referenced
Limitations:
- No possibility to send reports as email body
- Not possible to send multiple reports in a single email
- Not possible to generate reports by cycling through a field
- Not possible to filter data based on Power BI RLS
Alternatively, Power Automate tool could be used to generate exports of Power BI report and send by email. This also requires a Premium licence, but only for the developer. Although this cannot produce pixel perfect paginated reports like with the Report Builder, it comes with the inherent advantage of the Power Automate tool. With the Power Automate, the report sending process can be automated to a greater extent. For example, one would trigger a report sending based on events from other systems such as Dynamics CRM events, SharePoint activity
Qlik NPrinting
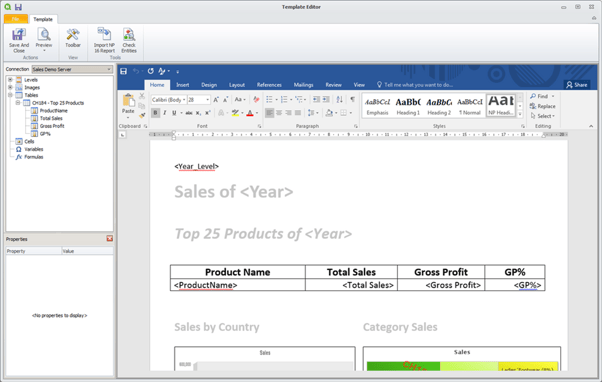
NPrinting is an add-on tool that works with Qlikview and QlikSense. Although Qlikview has a ‘Report’ feature and QlikSense has a ‘Story’ feature, they are not as feature rich as Nprinting and are quite limited in capabilities.
A major selling point of using Nprinting with Qlikview or QlikSense is that, if used effectively, it can bring some cost saving by reducing the licence needs of Qlikview and QlikSense, especially if the userbase is large. Since Nprinting licence is only based on the instances and engines (capacity), it can bring significant cost saving by sending canned report to many users, who would otherwise need to have Qlikview / QlikSense licence to access that information.
Below are some highlight features of Nprinting:
- ‘Newsstand’ report subscription and consumption portal
- Generate report from Accesspoint, though a QV server add-on
- Rest API Integration: Get task status, Run tasks
- Recipient list automation: Using RLS / Source system roles sourced from Qlikview/QlikSense
- Field Cycling: Generate s report for every value of a field. e.g., a Project manager could get separate report for every project under him in a single email
- Conditions: Check for a criterion to be fulfilled before sending a report. e.g., checking integrity of data; checking closure of a financial period etc.
Limitations:
- No task chaining possibility in version 17+ (Although it was present until version v16)
- No integration with QMC for running tasks. Such an integration would have enabled task chaining with Qlikview/QlikSense tasks
Final thoughts
While these reporting tools provide a rich feature set and great amount of report customization, these do have costs involved. The costs being: licence costs, learning curve, development effort and server setup & maintenance (in case of Nprinting). While Nprinting licence cost can be justified by the possible cost saving on Qlikview / QlikSense licence, the same could not be said about the Power BI report builder (since Pro licence is needed for viewing both Power BI report types).
In either case its best to use these specialized tools for creating and delivering canned reports based on the business/user needs since BI is all about delivering the relevant information in the right format in the right time.